Project Manager(s):
Ravi Seshadri (ravi@smart.mit.edu)
Sponsor:
National Research Foundation of Singapore
Team:
Ravi Seshadri, Moshe Ben-Akiva, Arun Prakash, Bilge Atasoy, Haizheng Zhang, Samarth Gupta, Yundi Zhang, Vu Vinh An, Mafahir Fairoze, Francisco Pereira, Constantinos Antoniou, Gary Tan
Start Date:
January 2011
Research Highlights:
- DynaMIT 2.0 is a next generation multi-modal traffic state prediction and network control platform.
- DynaMIT 2.0 enhances the online calibration capability of the original DynaMIT-R system through the simultaneous/sequential calibration of demand and supply parameters.
- DynaMIT 2.0 implements context mining and a scenario analyzer module to incorporate text based incident information.
- The system also includes a strategy optimization module that optimizes network control strategies in real time for congestion mitigation and other objectives.
Abstract:
DynaMIT 2.0 is a multi-modal multi-data source driven, simulation-based short-term traffic prediction system developed by SMART-FM. The system contains a collection of data modules and algorithms that estimate and predict network states in real-time. The main features of DynaMIT 2.0 include 1) the modeling of multiple modes including public transit, mobility-on-demand services such as Uber/Lyft, car and ride sharing, etc.; 2) Online calibration of demand and supply parameters using heterogeneous data sources; 3) context mining and the scenario analyzer for unstructured data, e.g. traffic incident reports; 4) The strategy optimization module for network control strategy optimization. DynaMIT 2.0 performs state estimation and state prediction at each interval of the simulation based on a rolling horizon and is designed to reside within a traffic management system (Figure 1). In the state estimation phase, the current network condition is estimated with real-time traffic information; in the state prediction phase, future short term network conditions are predicted and consistent traffic guidance information and optimal control strategies are determined.
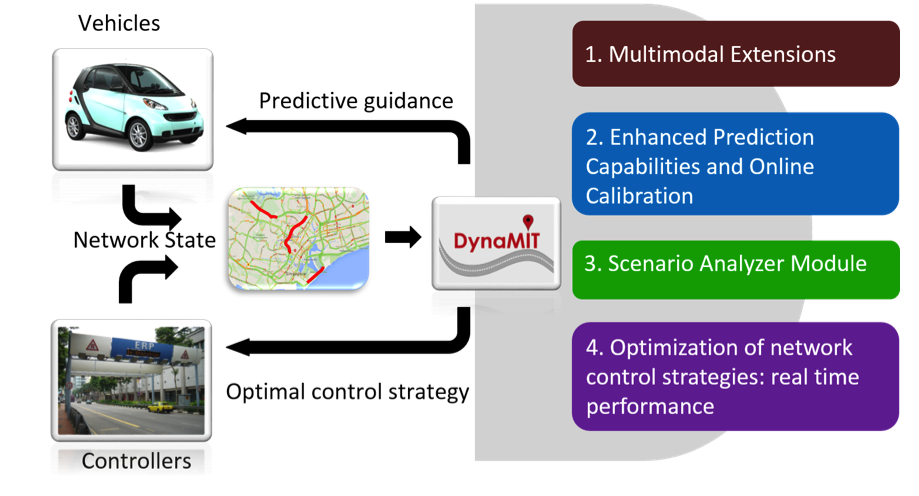
Figure 1. Real Time Traffic Management
Description:
I. BACKGROUND: REVIEW OF DYNAMIT 1.0
DynaMIT is a dynamic traffic assignment (DTA) system for traffic estimation and prediction developed at the MIT Intelligent Transportation Systems Laboratory (1). The core is composed of two sub-systems: 1) State estimation and 2) State Prediction. The operational structure of DynaMIT is presented in Figure 2.
State estimation combines the available surveillance with historical information to estimate the current state of the entire network. This involves the simulation of pre-trip demand allowing drivers with different characteristics to dynamically change their departure time, travel mode, and trip route by minimizing the difference between simulation results and observations from reality.
Based on this estimate of the current state of the network, the DTA model predicts future traffic patterns taking into account the response of the drivers to the provided guidance and traffic information. The outputs of the overall system are consistent forecasts of network conditions, including link density, flow speed, as well as travelers’ characteristics including their travel time, route choice and departure time.
The DynaMIT system has been applied to forecast traffic conditions in several major cities around the world, including Los Angeles, Beijing, Singapore, etc., and is recognized as one of the most advanced traffic prediction systems developed by academia. For a more detailed review of DynaMIT 1.0, readers can refer (1).
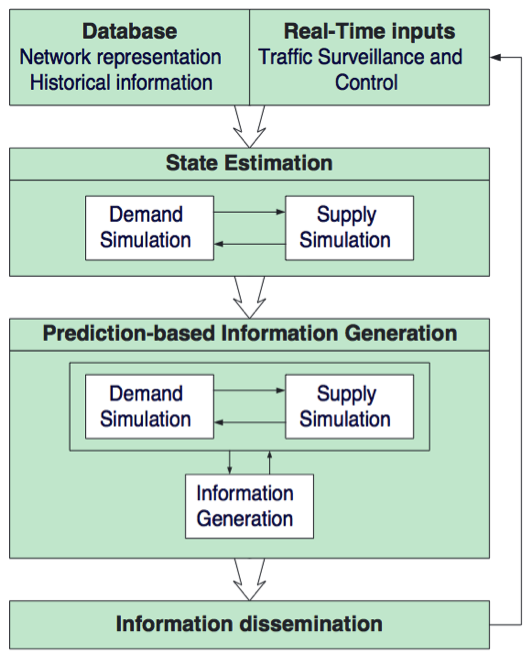
Figure 2. Architecture of DynaMIT1.0
II. DynaMIT 2.0: SYSTEM ARCHITECTURE
Figure 3 presents the overall architecture of DynaMIT 2.0. The system is composed of two major module clusters: the historical database manages all data sources used by the system (both historical and real-time); the DynaMIT core contains all sub models for state estimation and prediction. The state estimation module contains scenario analyzer and context mining, online parameter calibration; state prediction module contains online parameter prediction and strategy optimization.
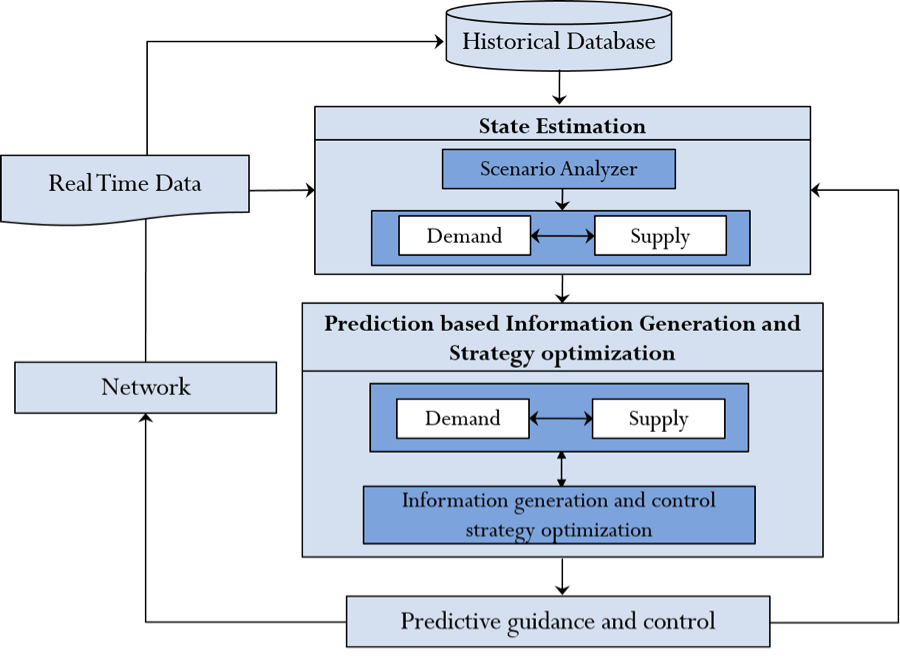
Figure 3. Architecture of DynaMIT 2.0
III. SCENARIO ANALYSER
Scenario Analyser (SA) translates non-structural incoming data streams into a demand/supply parameter pattern that is understandable for DynaMIT 2.0. All text based information is converted to a useful format through context mining. For example, special events websites provide rich spatial, temporal and semantic information that correlate with observed demand fluctuations (2, 3), social networks and micro-blogs such as Facebook and Twitter provide information of events from incidents (4) to crowd gatherings (5).
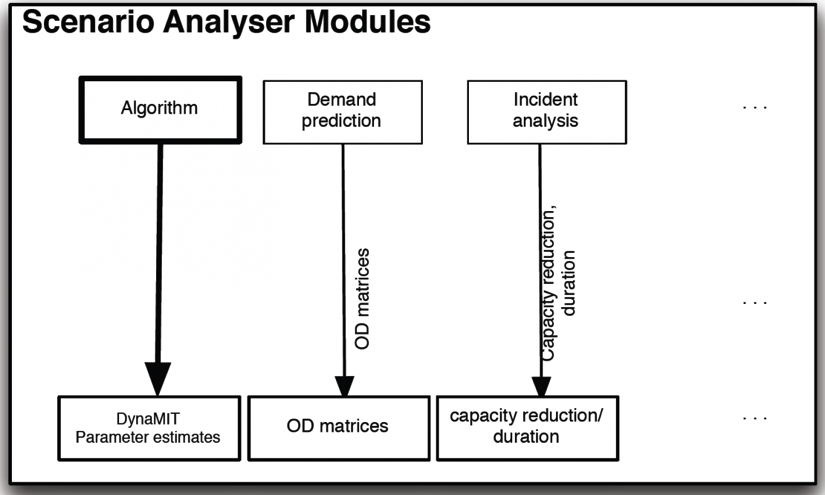
Figure 4. Scenario Analyser architecture
While DynaMIT core follows the model-based approach, SA builds on the data driven approach. It does so in a modular, plug-in approach, as illustrated in Figure 4. Currently, SA implements two models: incident duration prediction and special event demand prediction. Incident prediction reads the real-time incident reports text and performs recursive duration prediction through a topic modeling technique (6). The special event SAM analyzes the web based event (social gathering, etc.) information using a Bayesian additive linear model (or BALM) and predicts the change of total arrivals at different locations. For more detailed discussion, readers can refer (2).
IV. INTEGRATED ONLINE CALIBRATION
DynaMIT 2.0 adopts an integrated online parameter calibration model to dynamically adjust all of its internal parameters based on real-time observations. The parameter set contains three types: time-dependent OD matrices, behavior model and supply parameters. DynaMIT 2.0 has the flexibility to either 1) Calibrate the demand and supply parameters simultaneously using an Extended Kalman Filter (EKF), or 2) Calibrate the demand and supply parameters using a two-stage sequential calibration method. In the first stage, OD matrices are calibrated using link flow counts through a Generalized Least Square (GLS) formulation; in the second stage, route choice behavior and network supply parameters are calibrated using a the EKF method.
V. STRATEGY OPTIMIZATION
The function of strategy optimization is to provide an integrated framework to generate consistent guidance information and optimize network control strategies in real-time based on traffic state predictions. This can aid the mitigation of traffic congestion in scenarios of both recurrent and non-recurrent congestion. By taking advantage of parallel computing, the strategy optimization component allows the manager to simultaneously evaluate several strategies, taking into account the estimated and predicted traffic state, together with travel behavior. Optimization is performed to either to minimize total travel time or maximize total traveler welfare. Currently a GA (generic algorithm) is implemented in the strategy simulation module to optimize network control parameters such as dynamic tolls or ramp metering rates.
VI. Case Studies and Applications
A. Online Calibration on Singapore Expressway
The online calibration capability of DynaMIT2.0 is being tested on the Singapore Expressway network which consists of 1043 links, 3386 segments, 650 sensors and 4103 origin-destination pairs (Figure 5).

Figure 5. Singapore Expressway Network
The DynaMIT2.0 is evaluated in an offline-closed loop setup (Figure 6) where it is interfaced with a traffic microsimulator (MITSIM). The DynaMIT2.0 system is evaluated by examining state estimation and prediction performance against MITSIM (which is calibrated using traffic count data provided by the Singapore Land Transport Authority, LTA).
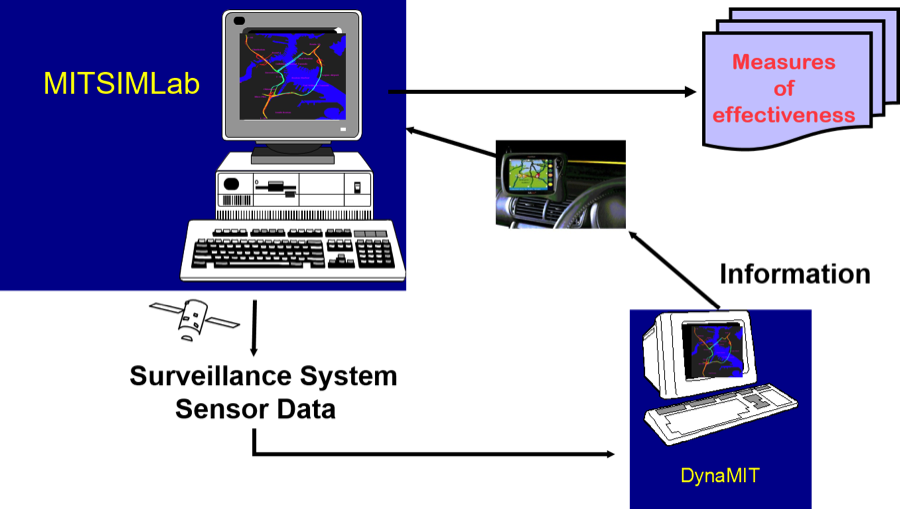
Figure 6. Offline-Closed Loop Evaluation
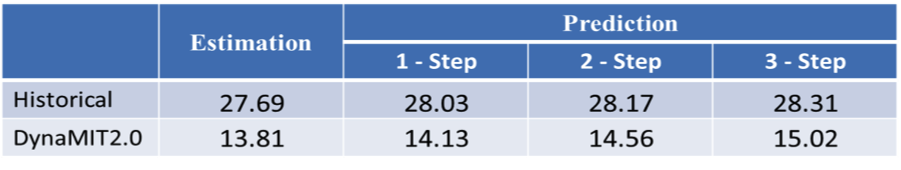
The results and summarized in Table 1 and Figures 7, 8 and demonstrate the accuracy of the state predictions for a prediction horizon of up to 15 minutes.
Table 1. Estimation and Prediction Performance: Errors in Sensor flow counts
B. Offline-Open Loop Evaluation
The DynaMIT2.0 system is evaluated using an offline-open loop evaluation (Figure 6.)
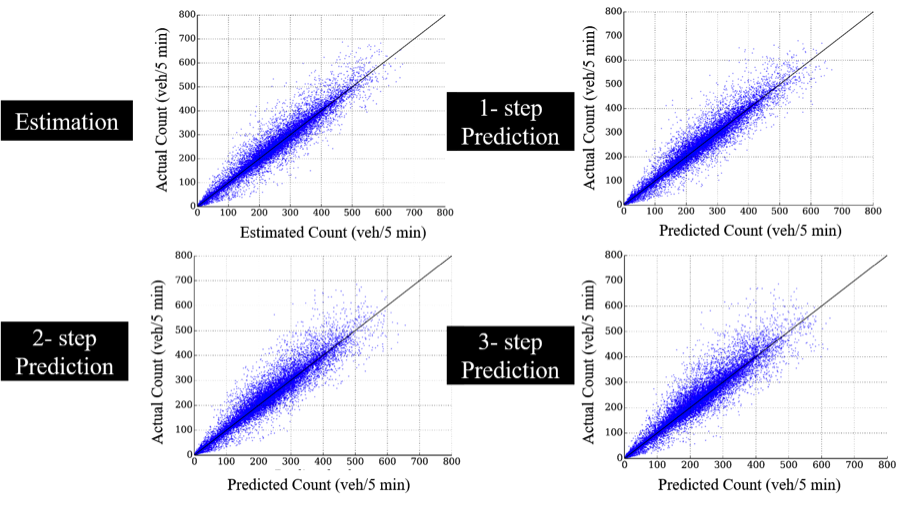
Figure 7. Scatter Plots of Simulated vs Actual Sensor Flow counts
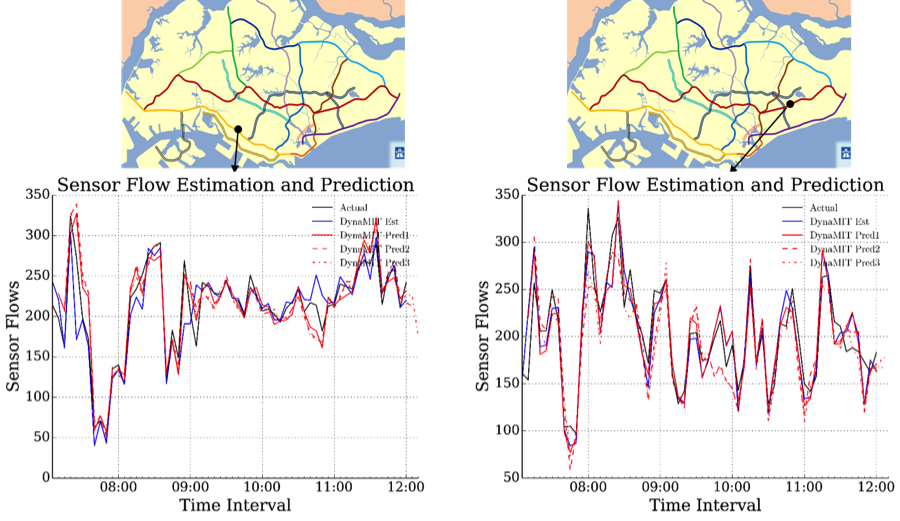
Figure 8. Estimation/Prediction Performance on Selected Sensors
In the future, it is planned to extend testing to the Singapore Urban network (Figure 9) that includes arterial roads and consists of 4363 nodes, 10332 links and 28952 segments.
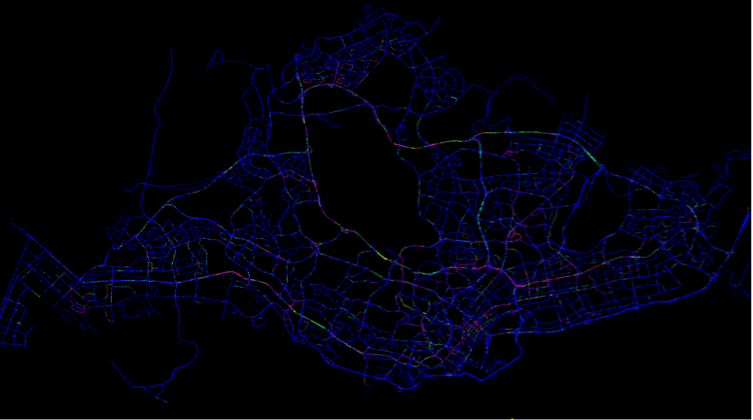
Figure 9. Singapore Urban Network
C. Incidents SAM
In DynaMIT 2.0, an incident is represented as a capacity reduction in the affected link during a period of time and it has been demonstrated that its predictions benefit considerably from the accurate consideration of such events (8). The role of the incidents SAM is to estimate the capacity reduction and predict the duration until clearance given an incoming feed of incident information (6).
This is done in a sequential and reactive manner. Incidents SAM sequentially updates its estimates taking into account the latest received text information. Topic modelling techniques (Latent Dirichlet Allocation, LDA (9)) are applied to extract a numeric combination of latent topics, which is in turn used for duration prediction using a radial basis function (RBF) algorithm.
In Figure 10, we show the performance of our sequential incident duration prediction algorithm, in 3 flavours: basic, which has the report creation information together with elapsed time; conservative, which has textual information together with elapsed time; all features, which has all possible information. The graph shows the Mean Absolute Percentage Error (MAPE) through time, and it can be seen that the complete model shows the best and more resilient performance. Interestingly, the text only (conservative) model is able to have comparable performance until 90 minutes. The reader will find more details in (6).
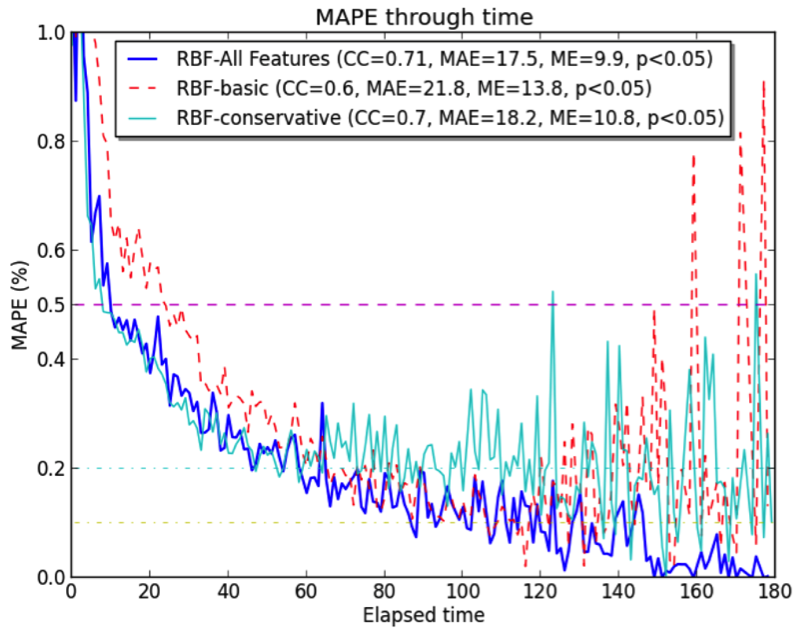
Figure 10. MAPE performance of incident SAM’s duration prediction algorithms
(CC=Correlation Coefficient; MAE=Mean Absolute Error; ME=Mean Absolute Error).
D. Incident Response Case Study
This case study investigates the impact of providing predictive guidance and optimal tolls under non-recurrent network disruptions. The incident scenario of interest is selected from the LTA database of incidents (on the 29th September, 2010) and is shown in Figure 11. The selected scenario involves two major accidents on the Pan Island Expressway (PIE) and Central Expressway (CTE) during the morning peak as well as two planned events (signboard installation and road-works) on the PIE. For the experiment, the period between 07:30 AM and 14:30 PM is simulated using: a) MITSIM independently with no guidance from DynaMIT2.0 and standard Electronic Road Pricing (ERP) toll rates, and b) the closed loop environment where MITSIM receives predictive travel time information and optimal tolls from DynaMIT2.0. Relevant performance measures (vehicle travel times) are obtained from MITSIM in the two cases and compared to determine the effect of the predictive guidance and optimal tolls.
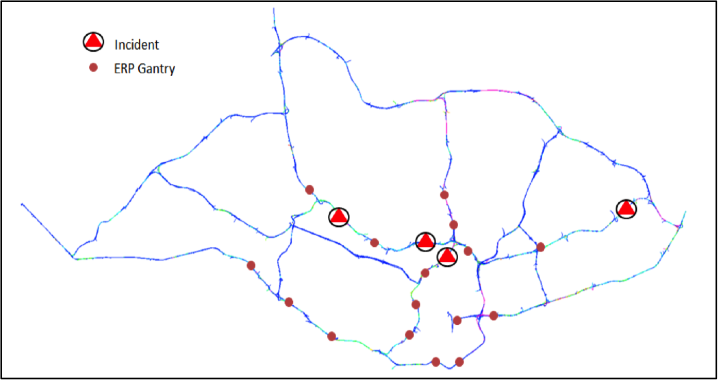
Figure 11. Singapore Expressway Network: Incident and Gantry Locations
The results from the simulation indicate that the provision of predictive guidance and optimal tolls from DynaMIT2.0 results in a significant reduction in total network travel times of 9.7% (83485 to 74700 vehicle hours). The travel time savings are even more substantial for the incident affected vehicles (vehicles traveling between a subset of OD pairs affected by the CTE incident, refer map in Figure 12) at 32.6% (2184 to 1473 vehicle hours).
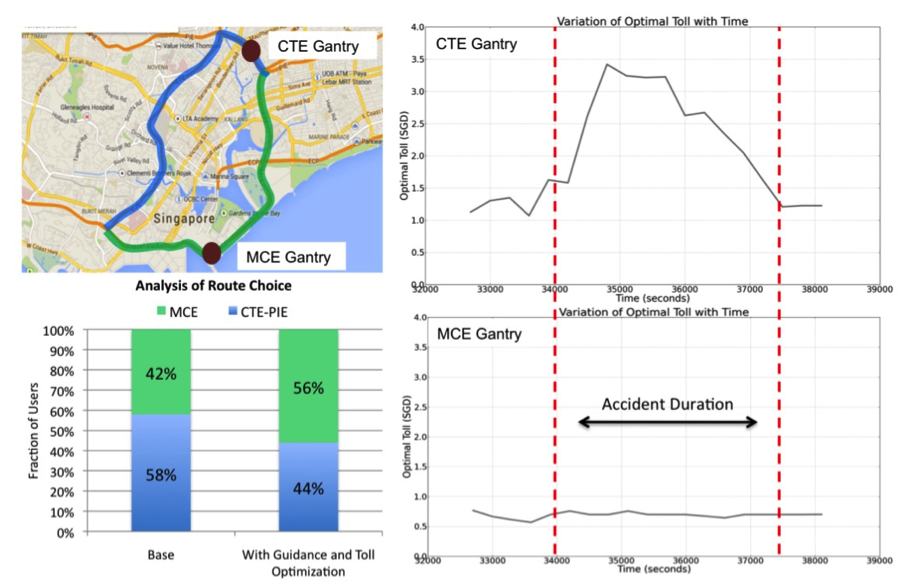
Figure 12. Case Study Results
An analysis of the route choice fractions for the vehicles traveling between the OD pairs shown in Figure 12 for the CTE and MCE routes further illustrates the role that information provision and dynamic toll optimization can have in affecting more efficient traveler decisions under incident scenarios. The figure shows that during the duration of the incident the optimal tolls on the CTE route gantry are significantly higher (average of 2.8 SGD) compared to the tolls on the MCE gantry (0.8SGD). This in combination with the predictive guidance results in a shift of 14% of the vehicles from the incident affected CTE route to the MCE route thus mitigating congestion and preventing the buildup of queues on the CTE route.
References:
-
[1] Ben-Akiva, M., H. N. Koutsopoulos, C. Antoniou, and R. Balakrishna, Traffic Simulation with DynaMIT. In Fundamentals of Traffic Simulation (J. Barceló, ed.), Springer, New York, NY, USA, 2010, pp. 363–398.
[2] Rodrigues, F., B. Ribeiro, and F. C. Pereira, A Bayesian additive linear model for understanding public transport usage in special events. In Submitted, under review, 2014.
[3] Gowrishankar, S., R. Stern, and D.Work, Including the social component in smart transportation systems. In National Workshop on Transportation Cyber-Physical Systems, Arlington, VA, 2014.
[4] Mai, E. and R. Hranac, Twitter Interactions as a Data Source for Transportation Incidents. In Proc. Transportation Research Board 92nd Ann. Meeting, 2013, 13-1636.
[5] Sugitani, T., M. Shirakawa, T. Hara, and S. Nishio, Detecting Local Events by Analyzing Spatiotemporal Locality of Tweets. In Advanced Information Networking and Applications Workshops (WAINA), 2013 27th International Conference on, IEEE, 2013, pp. 191–196.
[6] Pereira, F. C., F. Rodrigues, and M. Ben-Akiva, Text analysis in incident duration prediction. Transportation Research Part C: Emerging Technologies, Vol. 37, 2013, pp. 177–192.
[7] Lu, L., X. Yan, C. Antoniou, and M. Ben-Akiva,W-SPSA: An Enhanced SPSA Algorithm for the Calibration of Dynamic Traffic Assignment Models. Transportation Research Part C, Accepted - Forthcoming.
[8] Lopes, J. A., Traffic prediction for unplanned events on highways. Ph.D. thesis, Instituto Superior Tecnico, IST, 2012.
[9] Blei, D. M., A. Y. Ng, and M. I. Jordan, Latent dirichlet allocation. J. Mach. Learn. Res.,Vol. 3, 2003, pp. 993–1022.